Doctors aren't the only ones who can bring better health to our communities.
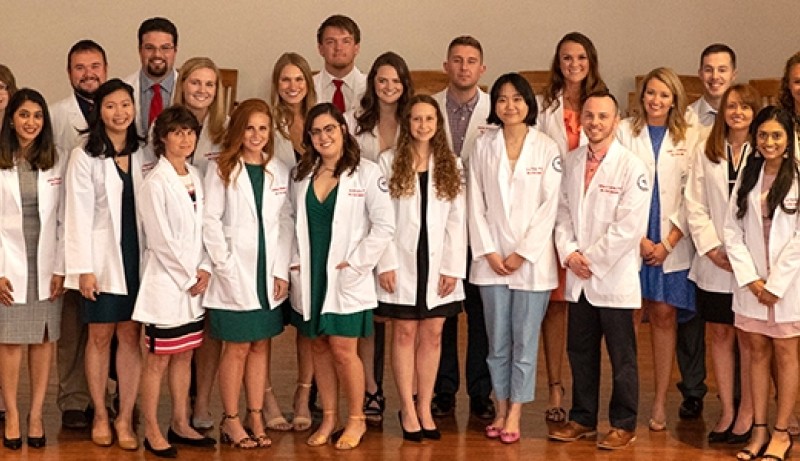
If you’re ready to advance your medical career without committing to several additional years of medical school, University of the Cumberlands offers the solution. Our Master of Science in Physician Assistant Studies (MSPAS) program is an accredited physician assistant graduate program available at both our Williamsburg and Northern Kentucky campuses. With a recent 100% PANCE pass rate at both locations, you can be confident you’ll receive the highest quality physician assistant education and training.
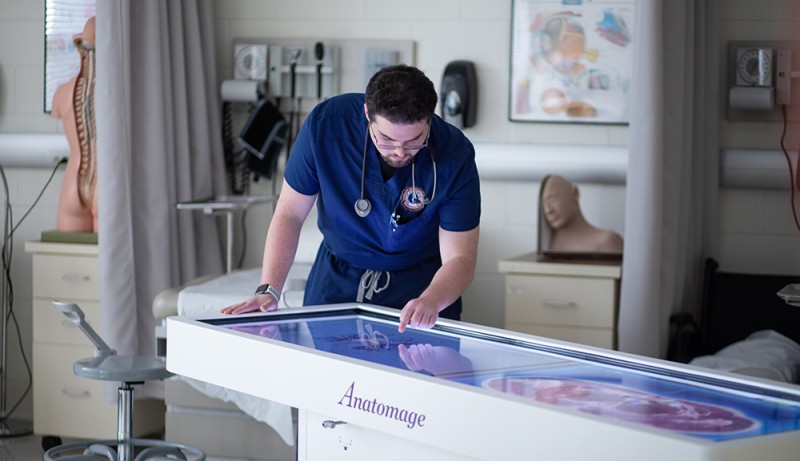
At Cumberlands, the master’s in physician assistant studies program is designed to prepare you for success as a skilled and compassionate PA. Through a combination of rigorous classroom instruction, pre-clinical sciences, and clinical rotations, you’ll gain the knowledge and hands-on experience needed to thrive in today’s healthcare field. Our curriculum covers everything from patient assessments and medical procedures to clinical medicine, pharmacology, and evidence-based care.
With the option to complete your PA program in as little as 27 months, you can enter the healthcare workforce sooner—equipped with the advanced clinical skills, critical thinking abilities, and practical training required to make a meaningful difference in patients’ lives.